The classifier in a scatter plot seems wrong, what is going on?
Class assignments in a scatter plot may be shown by the following statements
randreset(1); % just to make the dataset generation reproducible
a = gendatm;
gridsize(30); % this is the default value
scatterd(a);
plotc(qdc(a),'col');
title('qdc, gridsize=30');
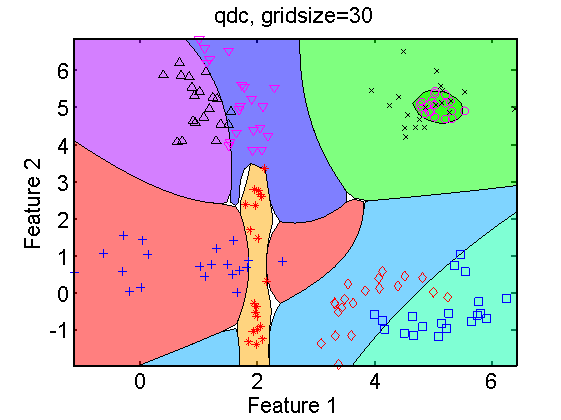
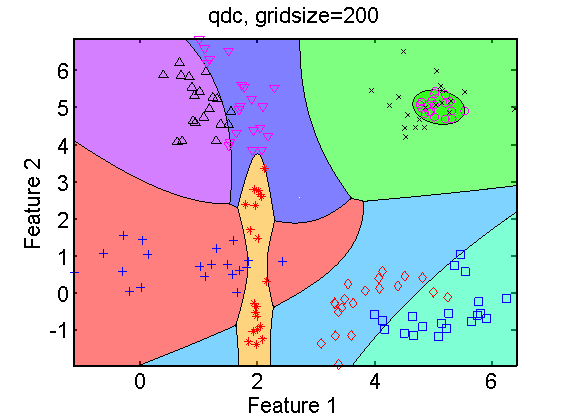
The left figure shows the results for the standard gridsize of 30. This means that the scatter plot is sampled by a grid of 30×30 points. They are classified and the result is shown. Some defects are visible. These are regions that are missed by the sampling. If more samples are used, e.g. in a grid of 200×200 points as shown on the right, the unclassified regions disappear.
There is another problem with the above plots. The two classes in the top right corner are given the same green color. With the present versions of plotc and the Matlab command fill that is used by it, it is not possible to solve this. There is however a workaround.
w = qdc(a);
w = w*featsel(8,randperm(8));
colorgridsize(200);
scatterd(a);
plotc(w,'col');
title('qdc, gridsize=200');
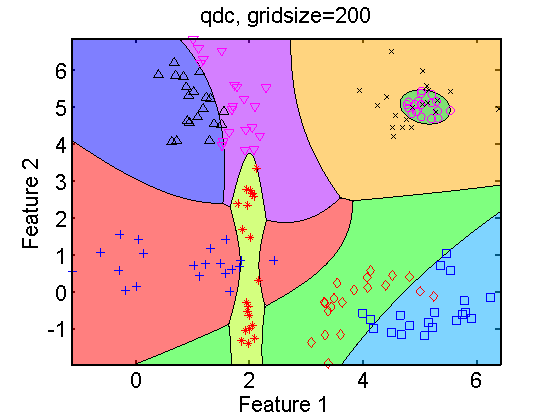
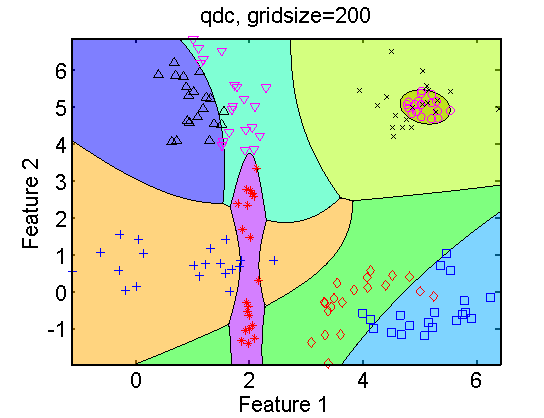
The statement w = w*featsel(8,randperm(8)); changes the order of the output classes of w at random and thereby modifies the colors of the plot. This is shown above for two repetitions of the above statements. Due to color overlap in the top right area the colors don’t just rotate.
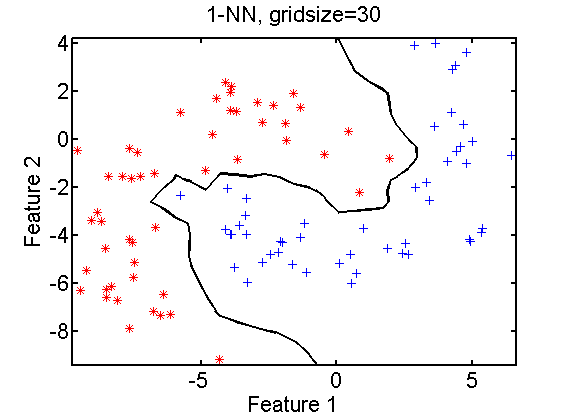
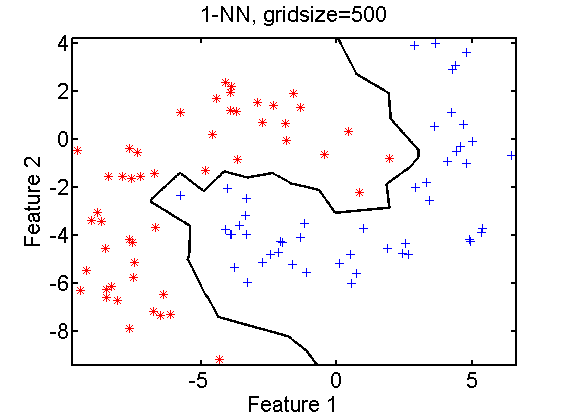
The value of the gridsize has also an influence on the accuracy of the plot of a classifier, as shown in the next example.
randreset(5);
a = gendatb;
gridsize(30);
scatterd(a);
plotc(knnc(a,1));
title('1-NN, gridsize=30');
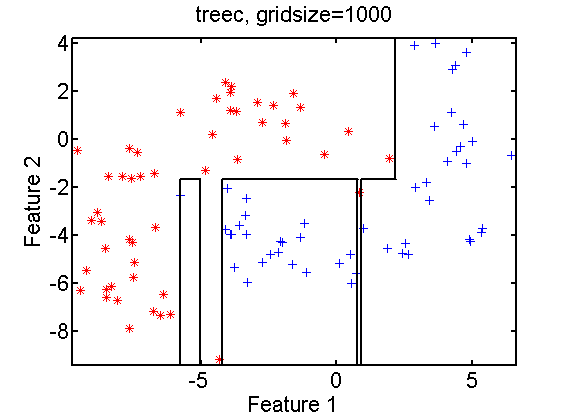
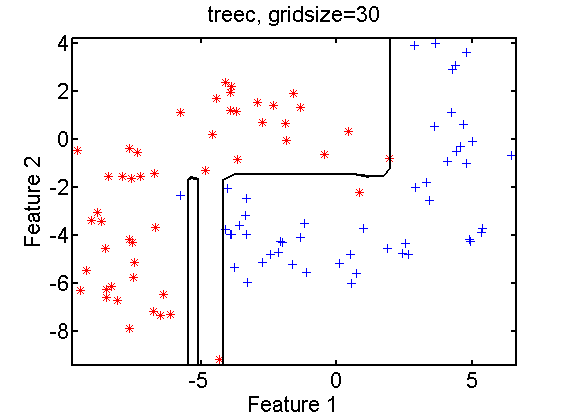
The result is shown in the above right figure. On the left the gridsize has been changed to 500. There are some minor differences visible. The computing time for the 1-NN classification increases significantly as for a gridsize of 500 the distances between 250000 and 100 training points have to be computed. For some classifiers the effect on the accuracy s much more dramatic as shown in the next figures below for a decision tree.
randreset(5);
a = gendatb;
gridsize(30);
scatterd(a);
plotc(treec(a));
title('treec, gridsize=30');
The result for a gridsize of 1000 on the right shows sharper corners, a more accurate positioning of the lines and some additional branches of the decision tree that fall entirely between grid points for a gridsize of 30.
