In science knowledge grows from new observations. Pattern recognition aims to contribute to this process in a systematic way.
- How is this organized in PRTools?
- What are the building blocks and how are they glued together? Do they constitute a sprawl or an interesting castle?
The most simple place where we can observe the integration of knowledge and observations is the classification of new objects by a given classifier. In PRTools terms, we have:
LABELS = TEST_DATA * CLASSIFIER * labeld
TEST_DATA is a set of observations of new objects, CLASSIFIER is a variable pointing to a procedure specifying the handling of the data and labeld is a command that converts the classification result into labels: the names of the classes. The * operation is in PRTools overloaded by piping: commands are evaluated left to right and * takes care that DATA is fed to CLASSIFIER. It knows how to handle it due to a proper object-oriented class definition.
After combining the observations with existing knowledge encoded in the classifier, we learn the labels. By this new knowledge about the observations is obtained. Two different processes can be distinguished:
- observations + knowledge
 enriched knowledge
 - observations + knowledge
 enriched observations
Within PRTools just operational knowledge is used: it can be used in procedures like the above. The encoding of such knowledge is called a mapping, observations are stored in datasets. PRTools is based on the definition of a large set of mappings. These are variables that can be combined by one of the above two ways with observations stored in a dataset. The first are trainable, yet untrained mappings. They may result in a trained mapping after being fed by observations. The second processes are enabled by trained or fixed mapping. They map observations into enriched observations in a fixed, well defined way.
This will be illustrated by a simple example in which the above classifier is derived from a set of observations, TRAIN_DATA.
CLASSIFIER = TRAIN_DATA * CLASSIFICATION_PROCEDURE
Here the user supervising the procedure plays an important role. He has to carefully select TRAIN_DATA such that it is representative for TEST_DATA. The observations that has to be classified later. Moreover, TRAIN_DATA should contain class labels. Here some expert knowledge is needed.
TRAIN_DATA = datafile(RAW_DATA,LABELS)
A datafile is a special type of dataset, useful for raw, unprocessed data. CLASSIFICATION_PROCEDURE is a mapping combining representation and generalization. We will use Fisher’s Linear Discriminant for the latter:
CLASSIFICATION_PROCEDURE = REPRESENTATION * fisherc
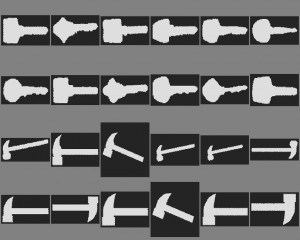
 This combines two mappings. Let us focus on blob recognition in which perimeter and area are used for representation, e.g. some images from the Kimia dataset, the classes ‘key’and ‘hammer’. (Note that the images have different sizes). First we need a mapping that determines the perimeters. We do not go in details. Here is a possible mapping:
PERIMETER =  filtim([],'contourc',[1 1])*...
                        filtim([],'size',2);
The AREA mapping may be written as:
AREA = im_stat([],'sum');
These mappings represent the knowledge of the user. He knows how to compute these features. This results into the following representation:
REPRESENTATION = [PERIMETER AREA]*datasetm
 The
The datasetm command just forces to store results into a a proper vector representation that includes the labels of TRAIN_DATA. So CLASSIFIER can now be written as:
CLASSIFIER = TRAIN_DATA * ...
    ([PERIMETER AREA]*datasetm*fisherc)
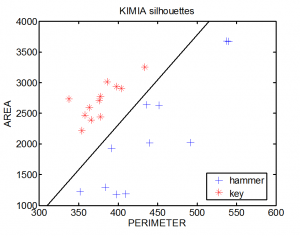
The additional brackets take care that the representation is included in CLASSIFIER. The scatterplot shows the representation for all images and the classifier based on them.
The PRTools commands to build the datasets and mappings and perform the classification of TEST_DATA are:
prdatafiles; KIMIA = kimia_images;             % Define the data
ALL_DATA = selclass(A,char('key','hammer'));   % Select the classes
[TRAIN_DATA,TEST_DATA] = gendat(ALL_DATA,0.5); % random split the data
CLASSIFIER = TRAIN_DATA *([PERIMETER AREA]*datasetm*fisherc); % train
TEST_DATA*CLASSIFIER*labeld         % classification of raw test data
The first three commands are just organizing the data. The mappings for representation (preprocessing) and generalization (training the classifier) are combined into a single mapping in order to make it applicalble to the raw TEST_DATA. The final result may look like:
key
key
key
key
key
key
hammer
hammer
hammer
hammer
hammer
hammer
This illustrates that knowledge and observations can build procedures by which the integrated sources may be applied to enrich new observations: class labels are estimated for new observations. The knowledge of the teacher, the expert defining the procedures and organizing the training data has become operational.
Filed under: Foundation • PR System • PRTools


